
For some, managing income in retirement is easy, especially if there are few sources of incoming funds. For most people, Social Security benefits provide the foundation of their income in retirement, which can be coupled with other sources such as pensions, IRA withdrawals, or income from rental property.
The switch from earning a salary to living on cash flows in retirement can be difficult. Once set up, cash flows in retirement may offer little flexibility. For example, once you make your Social Security election, it becomes irrevocable after 12 months of payments.
The popular press frequently addresses some of these issues with articles that purport to show how an individual or individuals can manage their income in retirement. An online search for “retirement income strategies†or “managing income in retirement†yields numerous articles, written from a variety of sources, and with such headlines as “Tax savvy withdrawals in retirement,†or “Five do’s and don’ts for tax efficient retirement withdrawals.â€
Sweeping generalizations about managing income in retirement are problematic in that they won’t really help any given individual figure out what is best for them.
The goal at REDW Wealth is to work with our clients to help them determine not only what’s best for the current tax year, but next year and the year after, as well. But before we look at specifics, we should first discuss some foundational issues relative to taxation and income.
Please contact us if you would like a free tax map of your current situation.
Learn more at our upcoming, complimentary webinar, “Managing Your Income & Optimizing Your Taxes in Retirement.”
How the tax system works
In the eyes of Congress, income is not created equally (Congress creates the tax code; the IRS just enforces it). Certain types of income may be included for taxation at different rates, such as 50%, 85% or 100%. Different types of income are also taxed at different rates. Add to that a progressive tax system, and different types of income are taxed at progressively different rates. Here’s how to make sense of all of it.
On the simplest levels, income is either taxable, partially taxable, or not taxable at all. In the latter case, tax-free municipal bonds yield income that is not taxable at all. However, adding a bit of confusion to the mix is the fact that a tax-free municipal bond issued by the state of California is generally only tax-free in the state of California. It remains free from income taxes at the Federal level, but will probably be subject to income taxes in other states. Social Security benefits, depending on other income, will be added to taxable income at a rate of 50% per dollar or 85% per dollar. The problem is that you need software to figure out just how much of your Social Security gets dragged onto your income tax return.
Additionally, some investment transactions have exceptions in the tax code as to how they will be taxed. For example, profits on selling a piece of property or a stock held for more than one year are taxed in an alternate system that taxes long-term capital gains like these. Congress has also seen fit to include dividends paid on corporate stock to be taxed under this alternate system. Ultimately a check that shows up in your mailbox will either be taxed as ordinary income, or, if it is a distribution from the stock or the sale of an asset held for more than a year, as long-term capital gains. These two systems work simultaneously in your tax return.
The following table details types of income and how they are taxed.
| Type of Income | Tax Treatment |
|
Ordinary income plus FICA and Medicare tax |
|
Ordinary income by percentage, 50% or 85% included |
|
Ordinary income |
|
Ordinary income |
|
Tax-free |
|
Long-term capital gain rates |
|
Ordinary income |
|
Long- or short-term capital gain rates, depending on holding period |
|
Ordinary income |
|
Ordinary income/depreciation offset |
|
Exempt from Federal tax; may be exempt from state tax |
It’s what you keep that counts
We believe that cash flow planning for retirement should focus on the end result rather than on the amount of money coming in the door. What you keep after all taxes are paid is your net income. The best result for any individual or family is to blend different sources of income in a way that allows you to keep the maximum amount of your money. Most people, however, including many investment advisors, have no real idea how to determine how a suggested investment will impact your income tax returns.
This is where a wealth management team that understands taxes becomes most important. Because we know taxes, we are able to suggest strategies that structure and optimize your net income in retirement. As an alternative, the popular press often makes broad generalizations about how to take money in retirement. For example, they often refer to the “bucket†approach, allocating retirement plan money to one bucket, after-tax money to another bucket, and maybe emergency funds in the third bucket. Some writers suggest averaging from all sources, while others suggest taking from the taxable bucket first, and still others think taking from the retirement bucket first is best.
The problem with these approaches is that they are not specific to you, the individual taxpayer. We believe in the long-term approach to planning for income in retirement. This means two things. First, that individuals need to start planning for retirement long before their actual retirement date. Second, we look at the net effect of planning and taxation over the lifetime of retirement to maximize wealth based of your needs and objectives. For one individual it may mean reviewing Roth conversion possibilities, while for another it may mean maximizing retirement plan accounts.
The planning timeline
Planning for income distributions in retirement needs to begin sooner rather than later. We understand that for many individuals and families, financial pressures such as funding for college or taking care of health issues often get in the way of setting aside money for retirement. For those who can, we recommend starting as early as possible and in looking with real seriousness at planning opportunities beginning at age 50. This age is important because it is the point in time that retirement plan participants can start adding catch-up contributions to their accounts. For example a 401(k) plan in 2021 allows for a maximum contribution of $19,500. At age 50, a catch-up contribution of an additional $6,500 per year is allowed. This brings the maximum retirement plan contribution in 2021 to $26,000.
Additionally, between the ages of 59 ½ and 72, there are no rules for taking money out of retirement plans. By age 72, however, participants with money in retirement accounts must begin to take money from their retirement accounts. The amount of the required distributions is generally somewhere in the neighborhood of 4% per year. Next year new tables will dictate that individuals aged 72 must start their withdrawals by dividing their account balance by a factor of 27.4. That number is fixed and means that a recipient must take approximately 3.65% of their account out in the year that they turn 72. That withdrawal cannot be avoided, ignored or missed. If it is ignored, the consequence is a tax penalty of 50% of the amount that should have been withdrawn. Therefore the stretch of time between the ages of 59 ½ and 72 is one where withdrawal planning may assist individuals in building their best possible cash flow for retirement.
During this period of time, income often changes year to year because new cash flows are added or subtracted at various times during this period. Social Security benefits for one spouse may start in the middle of one year while the other may take their benefits three or four years later. One individual may reach the trigger point for required distributions years before another. We see this as an opportunity for decision making on an annual basis to either shore up your plans for retirement or maybe change how the ultimate allocation of income is going to work. One of our primary tools in this task is what we call the tax map.
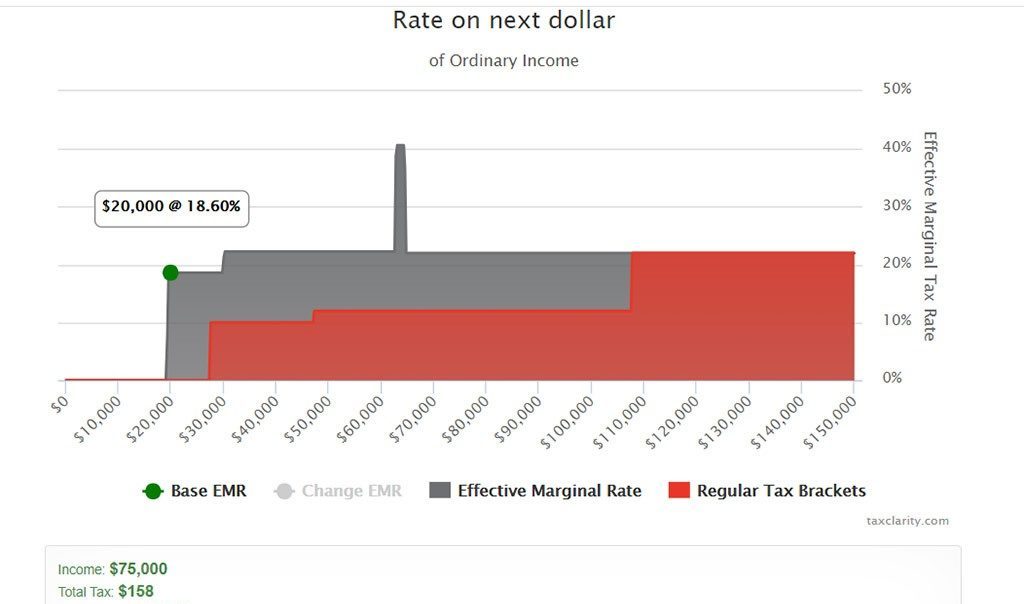
The tax map is a chart the shows the difference between the published income tax brackets and the reality of where your personal situation fits into the tax code. The red part of the graph represents the Federal income tax regular brackets. This particular map displays income up to $150,000 of income and illustrates the current sum of income and taxes for an individual taxpayer. The current position is indicated by the green dot. Normally, a taxpayer would be in either a 10, 12, or 22% income tax bracket on his or her ordinary income. However, in this situation, Social Security income has been brought onto the tax return and it creates the gray shaded tax area that displays how current and future additional income will be taxed. This client’s next dollar of income will be taxed at a rate of 18.6%, not including state income taxes. However, since no additional income is expected, the result is very desirable. With a blended total of $75,000 of household income, the Federal income tax bill is only $158. This is a taxpayer that has optimized their cash flow to pay minimal taxes on their retirement income.
Â
Where should my next $20,000 of income come from?
As a planning exercise, our tax team decided to analyze how various types of income would affect net income. We charted a grid of tax returns to look for the best sources of income for our hypothetical taxpayers. Using three different married couples in retirement, we started with the following chart of income and its sources.
| Source | Taxpayer 1 | Taxpayer 2 | Taxpayer 3 |
| Social Security | $45,000 | $45,000 | $55,000 |
| Interest | $10,000 | $10,000 | $10,000 |
| IRA / Pension | $24,000 | $50,000 | $60,000 |
| Total Income: | $79,000 | $105,000 | $125,000 |
What are the possible sources of additional income?
The income sources used for this analysis come from the following:
- Increased Social Security income by delaying benefits
- Retirement plan withdrawals
- Tax-free municipal bonds
- Qualified dividend income
- REIT income with a 20% qualified business deduction applied
- Income from investment real estate
- Long-term capital gains
These sources were chosen because of their unique effects on the tax return. Additionally, we created five subdivisions for the investment income from real estate and for the long-term capital gains. Those subdivisions changed the amount of income that was taxable from 20% to 100% in those two categories. The following charts show the results.
The married couple with $79,000 of base income would receive the following income tax increases if they were to add $20,000 from any of the 15 different sources listed. Note that taxes range from zero to $6,253 per year.

The couple with $105,000 of base income had the following tax results.

The couple with $125,000 of base income had these income tax results.

Conclusions
Each individual taxpayer, whether married or single, has a very unique income tax situation, especially for the years prior to taking minimum retirement plan distributions. Once Social Security income is added to the tax return, predictions of the tax effect of additional income become insurmountable without using tax planning software. At the low end of this analysis, taxation ranged from zero to over 31%. At the highest base income, additional income was taxed between zero and 26.9%.
It is very important to note that the worst tax performer in every case is sometimes the go-to investment that advisors will suggest: a retirement plan distribution or any other form of straight up ordinary income. Many of the annuity sales that we see are structured around providing income in retirement that will produce the maximum in income taxes.
Even though long-term capital gains and qualified dividends are part of the same system, they produce different results for clients when state income taxes are considered.
Most importantly, each tax map and analysis is unique for each taxpayer. Unless you have the same exact sources of income, no two taxpayers will share the same tax map. That’s why it is critical to have a financial advisor who understands the impact of income taxes on the income you plan to have in retirement. Additionally, because there are so many factors to consider when approaching retirement, starting your planning early may have a significant impact on the money you get to keep in retirement. At REDW Wealth we are here to help guide you through the many issues that surround good retirement planning.
Please contact us if you would like a free tax map of your current situation.
Learn more at our upcoming, complimentary webinar, “Managing Your Income & Optimizing Your Taxes in Retirement.”


